Contribute
| Technology - Evaluation Of Long-Term Seating Comfort Through Simulation Of Driver Movement |
Shawn McGuan
08/23/2006
Introduction
Many factors play a role in the purchase of a new car, e.g. styling, safety and performance. Seating comfort is also an important issue and manufacturers use comfort to distinguish their products from their competitors.
The introduction of a new seat or car interior is both time consuming and costly, requiring many physical prototypes. This is the case because the assessment of seating comfort is still mainly based on subjective measurements. Often times these subjective measurements and impressions do not produce sufficient knowledge to measure or characterize a particular seat's performance.
To increase this knowledge base, it is proposed that during long term exposure in an automobile seat, the driver will change posture over time to minimize discomfort of the seat. These posture changes and adaptations, although very subtle, can quantifiably characterize the comfort level of a particular automobile seat.
Taken a step further, these posture changes and adaptations can be studied in depth with a sophisticated biomechanics computer model of the driver. With this model, internal body forces and reactions to the environment can be studied in detail in the early stages of the design process, thereby reducing the development costs of the vehicle. Additionally, the computer model allows the identification of discomfort increasing seat properties, which can than be optimized virtually. The computer model can also provide data for characterization methods such as the KFS-Method (LWS Risk Management Consulting Group) to obtain an absolute rating of the seat comfort with only a few test subjects.
This article introduces a new technique using LifeMOD™ human simulation models to illustrate long-term posture changes of a professional driver. Using highly accurate ultrasonic motion capture sensor technology, such as the sonoSens® system available from Friendly Sensors AG, attached directly to the skin, this method provides many hours of data for regions of the body normally obscured by traditional optical motion capture technologies.
Data Collection
It is quite difficult to obtain accurate spinal motion from a seated occupant using traditional optical motion sensor technology. Traditional technology requires that the sensors be visible to the digital cameras in order for data to be acquired. The detailed information on body movement required for simulation, particularly the postural changes of the spine, are hidden from cameras when the driver's back is pressed against a seat.
A new method of small ultrasonic sensors applied directly to the skin can record many hours of data using a belt mounted data recorder. This arrangement is completely unobtrusive to the wearer of the device. Figure 1 displays the ultrasonic marker placement on the back to track the 3-dimensional motion of the spine.

Figure 1. Ultrasonic sensor pairs distributed on the back to track 3-dimensional spinal motion regions. The sensors report relative displacements between the pairs and data is recorded in a solid-state unit worn on the belt. Motion agents are automatically created at the ultrasonic sensor locations in the experiment. They will drive the model to capture joint motion patterns to be used in a subsequent forward dynamics analysis.
Model Development
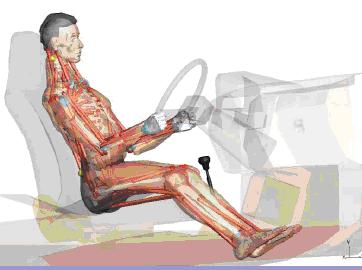
LifeMODâ„¢ was used to develop a model of the professional driver. Forty-seven specific body measurements were recorded from the driver and used in conjunction with the anthropometric library within LifeMODâ„¢ to create a 19-segment human model closely approximating the segment dimensions and mass properties of the driver.
The rider model was positioned in a car interior model complete with seat, pedals, steering wheel and controls. The contact forces between the seat were created from the contact for library in LifeMODâ„¢. The contact force was based on a discretized cushion property model derived from local compression measurements on the seat.
The hands were fixed to the steering wheel, which was given a passive stiffness/damping profile. The feet contacted the floorboard and the pedals using contact elements.
LifeMODâ„¢ motion agents are automatically created at each ultrasonic sensor location. Motion agents are elements which will be driven using the recorded trajectory information from the experiment. Each motion agent is associated with the model using spring forces.
The ultrasonic sensors produce data designated by channel pairs A, B, C, D, E, F, G, H, I, J, K, and L (see Figure 3). The relative displacements between the sensor pairs can be used to measure spinal flexion/extension, twist and side motion (see Figure 4).


With the LifeMODâ„¢ human model created and positioned in the seat and the motion agents positioned at each ultrasonic sensor location, the model is now ready for inverse-dynamics analysis. In this stage, the model is passive and will be driven by the motion agents. Since there are no motion agents to prescribe the motion of the arms and legs, their motion will be defined by the activity of the spine and the model's dynamic interaction with the environment, all under the influence of gravity. The hands will remain attached to the steering wheel and the feet to the floorboard. Contact forces between the seat and the driver's back, lower torso and legs will be active. During this dynamic simulation, the three-dimensional joint angles at each anatomical joint are recorded.
Next, the motion agents are removed from the human model and proportional-derivative controllers are automatically generated by LifeMODâ„¢ to create torques which drive the anatomical joints by minimizing the error between the desired angle and the instantaneous angle. With the torques now driving the joints, the model becomes an active human model.
Figure 5 summarizes the model building and simulation process.

Results
Two types of model output were examined to provide a measure of comfort: the spinal postural changes over the term of the driving exercise and the spinal joint torques integrated over time to provide a measure of energy expenditure to accommodate the seat.
Figure 6 displays the thoracic regional joint angle in the sagittal plane. It can be observed over the 170 minutes of the experiment that there is a significant posture change displayed as a change in the thoracic joint angle. This is due to an unconscious posture change to effectively reduce discomfort during the driving experience. The driver adopts postures that minimize the energy necessary to maintain a comfortable sitting posture.

Figure 7 displays the thoracic regional joint torques in the frontal plane. This plot indicates a level of energy expenditure necessary to increase the level of comfort. Off-balance postures increase torques, and these additional loads on the spine require additional levels of energy to maintain the posture.

Figure 8 displays a comparison between a "good" seat (gray curve) and a "poor" seat (red curve). The curves represent trunk postures over the 170 minute driving experience. The curves indicate that the poor performing seat required more trunk motion to adjust to a comfortable position.

Conclusions
This study represents an on-going effort into providing additional measures of vehicle seat ride comfort. By using posture data and muscular action data from a biomechanics model, it will augment the subjective data provided by the professional test drivers. Studies continue in classification and processing the data as well as the development of specific modules to enhance LifeMOD's ability to support a general seat comfort environment.
You may also access this article through our web-site http://www.lokvani.com/
